Microbit Computer Science
Beginner
80 mins
Teacher/Student led
What you need:
Chromebook/Laptop/PC

Flowcharts and Pseudocode

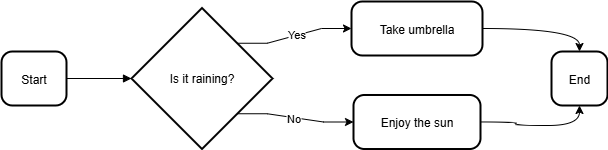
In this lesson, you'll explore algorithms by learning to create flowcharts and pseudocode. Follow step-by-step tasks to design visual and text-based plans, then apply them to code a simple program using MakeCode for micro:bit.
Learning Goals Learning Outcomes Teacher Notes

Live Class Feed

This is a live feed of the latest activity by your students on this lesson. It will update in real-time as they work on the lesson.
Load previous activity

    1 - Introduction

    In this lesson, you'll build on your understanding of algorithms and flowcharts, and learn about pseudocode as a tool for planning code. You'll create your own flowcharts and pseudocode, then see how they translate into a simple program using MakeCode for micro:bit. By the end, you'll design your own algorithm from scratch.

    Here's what you'll cover:

    1. Recapping flowcharts and their key shapes.
    2. Creating a flowchart for an online shopping cart.
    3. Introducing pseudocode and its features.
    4. Writing pseudocode based on your flowchart.
    5. Coding a temperature reaction program in MakeCode.
    6. Designing your own algorithm with a flowchart and pseudocode.

    2 - Recapping Flowcharts

    In the previous lesson we introduced you to algorithms and flowcharts, let's recap what we learned.

    Algorithm

    An algorithm is simply a step-by-step set of instructions that helps you solve a problem or complete a task. Imagine it as a clear guide that tells you exactly what to do, one thing at a time, in the right order, so you end up with the result you want.

    Key Properties

    1. Precise - every step is clearly defined, like "add 2 cups of flour" not "add some flour"
    2. Finite - it ends after a fixed number of steps, like a recipe that finishes when the cake is baked
    3. Effective - it solves the problem correctly, like a sorting algorithm that always sorts the list properly
    4. Efficient - it does the job with minimal steps or time, like quicksort vs bubble sort

    Flowcharts

    Flowcharts are visual representations of algorithms using shapes and arrows to show the flow of steps and decisions.

    Basic Shapes

    Oval

    Used for the start and end of the algorithm. It marks where the process begins and finishes.

    Rectangle

    Represents a process or action step, like "Display a message" or "Calculate a sum".

    Diamond

    Indicates a decision point, where the flow branches based on a yes/no question, such as "Is it raining?".

    Parallelogram

    Often used for input or output, like reading data from a user or showing results.

    Arrow

    Shows the direction of the flow, connecting the shapes in the correct order.

    Example Flowchart

    Here's a simple flowchart for making a decision about going outside based on the weather: It starts with an oval 'Start', then a diamond decision 'Is it raining?', with 'Yes' leading to a rectangle 'Take umbrella' and 'No' leading to a rectangle 'Enjoy the sun', both connecting to an oval 'End'.

    3 - Practical Task: Create a Shopping Cart Flowchart

    Now it's time to practise creating your own flowchart. You'll design a simple flowchart for an online shopping cart process using the tool you've used before at www.drawio.com.

    The flowchart should represent a basic online shopping experience: starting from browsing items, deciding to add to cart, continuing shopping or checking out, and ending with payment confirmation.

    Follow these steps to create your flowchart.

    Note: You do not have to use this algorithm and flowchart exactly, you can design your own online shopping algorithm.

    1. Open your web browser and go to www.drawio.com. Choose to create a new diagram (select 'Blank Diagram' if prompted).
    2. On the left sidebar, find the flowchart shapes (look for categories like 'Flowchart' or 'Basic'). You'll need ovals for start/end, rectangles for processes, diamonds for decisions, parallelograms for input/output, and arrows to connect them.
    3. Start by dragging an oval shape to the canvas and label it 'Start'.
    4. Add a rectangle below it labelled 'Browse items'.
    5. Connect them with an arrow.
    6. Next, add a diamond for the decision 'Add item to cart?' with arrows branching to 'Yes' and 'No'.
    7. For 'Yes', add a rectangle 'Add item to cart', then loop back to 'Browse items' with another decision or directly.
    8. For 'No', add another diamond 'Checkout?' with 'Yes' leading to a parallelogram 'Enter payment details', then a rectangle 'Confirm payment', and finally an oval 'End'.
    9. If 'No' to checkout, loop back to 'Browse items'.

    Make sure all paths connect logically with arrows showing the flow. Adjust the layout to make it clear and readable. You can add colours or resize shapes if you like. Once complete, save your diagram (you can export it as an image or PDF if you want to keep it).


    4 - Introduction to Pseudocode

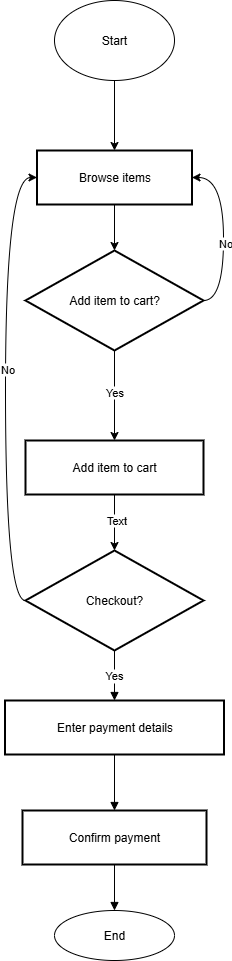
    Let's move on to another important tool for planning algorithms: pseudocode. Pseudocode is a way to describe the steps of an algorithm using simple, human-readable language that looks a bit like programming code, but without worrying about the exact rules of a specific programming language. It bridges your flowchart to potential code.

    What is Pseudocode?

    Pseudocode acts as a bridge between your ideas (like those in a flowchart) and actual code. It helps you outline the logic of your program clearly before you start coding. This makes it easier to spot mistakes early and ensures your algorithm is precise, finite, effective, and efficient.

    Key Features of Pseudocode

    1. Readable: It uses everyday words mixed with code-like structures, so anyone can understand it.
    2. Flexible: No strict syntax – you don't have to worry about semicolons or brackets.
    3. Structured: It often includes keywords like IF, ELSE, WHILE, FOR, to show decisions and loops.

    Common Elements

    • Variables: Assign values, e.g., SET age TO 16
    • Input/Output: READ input or DISPLAY message
    • Decisions: IF condition THEN ... ELSE ... END IF
    • Loops: WHILE condition DO ... END WHILE or REPEAT ... UNTIL condition
    • Start/End: Often begins with START and ends with END

    Example Pseudocode

    Remember the weather flowchart from earlier? Here's how it might look in pseudocode:

    START

    IF it is raining THEN
        Take umbrella
    ELSE
        Enjoy the sun
    END IF

    END

    This matches the flowchart's decision diamond and process rectangles, but in text form. It's simple and helps you think through the steps before coding.

    Pseudocode is great for planning because you can refine it until it's perfect, then translate it directly into real code. In the next steps, you'll practise writing your own and see how it turns into a working program.

    5 - Practical Task: Write some Pseudocode

    Now that you've created a flowchart for an online shopping cart process, it's time to translate that visual plan into pseudocode. This will help you practise turning your algorithm ideas into a text-based outline that's closer to actual code.

    Use the flowchart you designed in the previous practical task as your guide. If you followed the suggested steps, your flowchart includes browsing items, deciding to add to cart, continuing shopping or checking out, and ending with payment confirmation. But remember, you can base this on your own version if you customised it.

    Follow these steps to write your pseudocode. You can do this in a text editor, notebook, or even the notes section of your diagram tool.

    1. Start with START to begin the algorithm.
    2. Describe the initial action, e.g., DISPLAY "Browse items".
    3. For decisions, use IF statements, like IF user wants to add item to cart THEN followed by the action, such as Add item to cart, and ELSE for the other path.
    4. Include loops for repeating actions, like WHILE shopping continues DO ... END WHILE.
    5. For input/output, use terms like READ payment details or DISPLAY "Payment confirmed".
    6. End with END.

    Example based on the suggested flowchart:

    START

    DISPLAY "Browse items"

    REPEAT
        IF add to cart? THEN
            Add item to cart
        END IF

        IF checkout? THEN
            READ payment details
            Confirm payment
            DISPLAY "Thank you for your purchase"
            EXIT LOOP
        END IF
    UNTIL checkout is selected

    END

    Adapt this to match your flowchart. Make sure your pseudocode is clear, structured, and covers all the steps and decisions. Once done, review it to ensure it logically follows your flowchart and would lead to a working algorithm.

    Unlock the Full Learning Experience

    Get ready to embark on an incredible learning journey! Get access to this lesson and hundreds more in our Digital Skills Curriculum.

    Copyright Notice
    This lesson is copyright of DigitalSkills.org. Unauthorised use, copying or distribution is not allowed.
    🍪 Our website uses cookies to make your browsing experience better. By using our website you agree to our use of cookies. Learn more