We'll create a basic linear regression model to predict house prices based on size – a supervised learning example.
Linear regression is a fundamental machine learning algorithm used for predicting a continuous outcome variable based on one or more predictor variables. It assumes a linear relationship between the input features and the target variable. The goal is to find the line of best fit, which is determined by minimising the sum of the squared differences between the observed values and the values predicted by the line. In simple linear regression, like our example, there's one feature (house size) and one target (price), and the model learns the slope and intercept of the line that best represents the data.
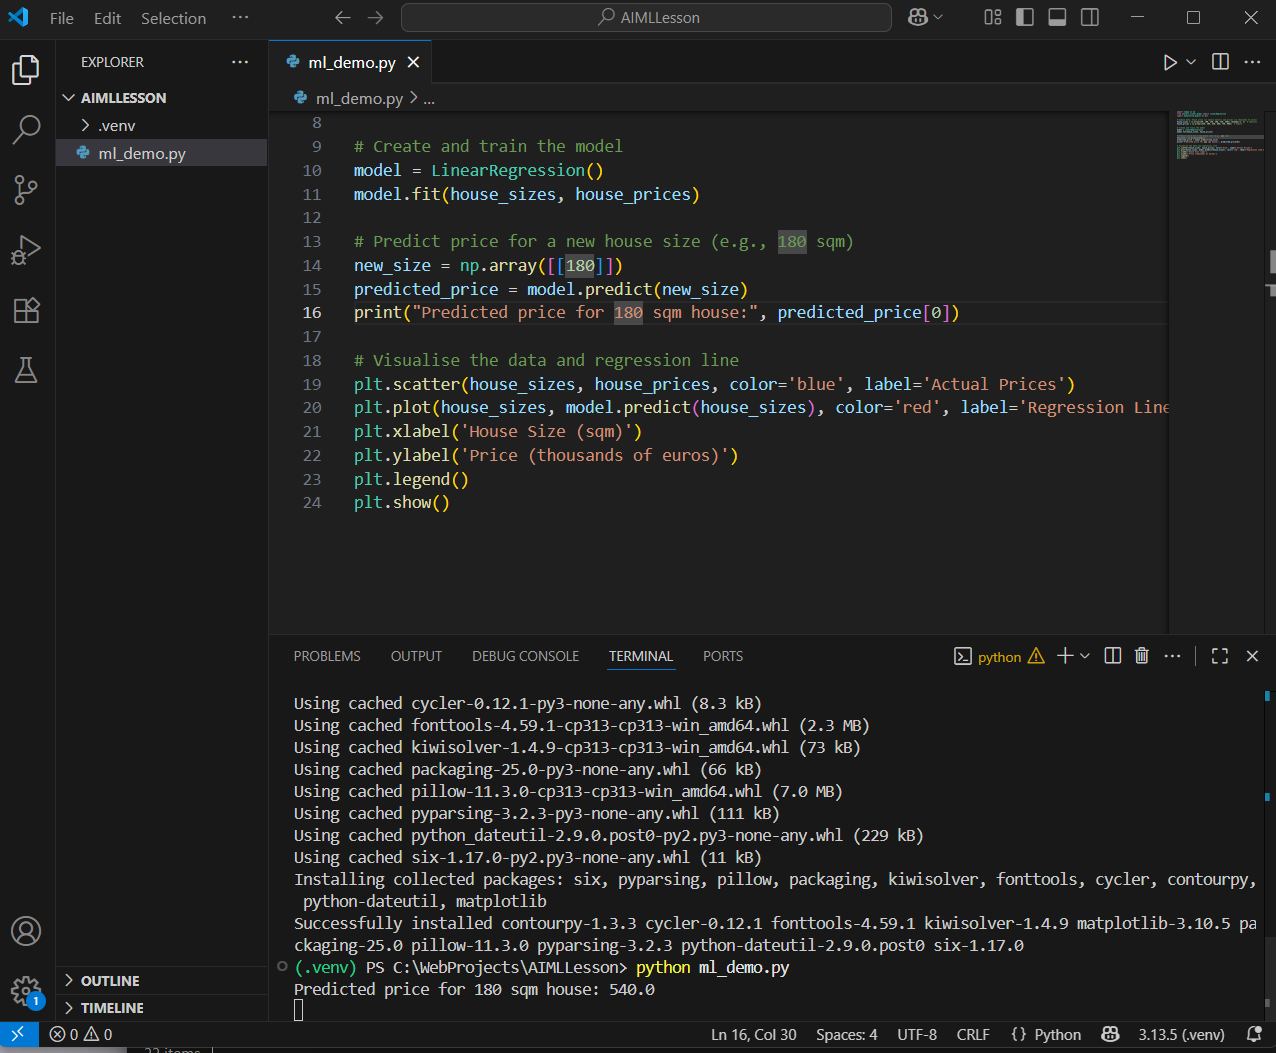
Create a file named ml_demo.py inside your AIMLLesson folder, and add the following complete code to it:
import numpy as np  # NumPy is a library for numerical computing in Python
from sklearn.linear_model import LinearRegression
import matplotlib.pyplot as plt

# Sample data: house sizes (in square meters) and prices (in thousands of euros)
house_sizes = np.array([50, 100, 150, 200, 250, 300]).reshape(-1, 1)  # Features
house_prices = np.array([150, 300, 450, 600, 750, 900])  # Labels

# Create and train the model
model = LinearRegression()
model.fit(house_sizes, house_prices)

# Predict price for a new house size (e.g., 180 sqm)
new_size = np.array([[180]])
predicted_price = model.predict(new_size)
print("Predicted price for 180 sqm house:", predicted_price[0])

# Visualise the data and regression line
plt.scatter(house_sizes, house_prices, color='blue', label='Actual Prices')
plt.plot(house_sizes, model.predict(house_sizes), color='red', label='Regression Line')
plt.xlabel('House Size (sqm)')
plt.ylabel('Price (thousands of euros)')
plt.legend()
plt.show()
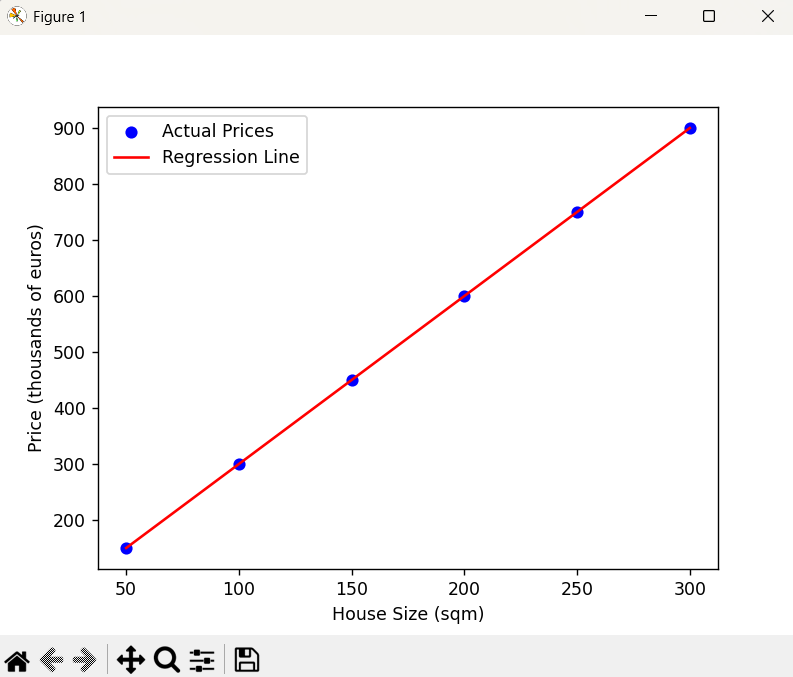
Run the code in VS Code terminal with python ml_demo.py. You should see a predicted price around 540 and a plot showing the data points and line. This demonstrates how ML algorithms learn from data to make predictions.
Linear regression finds the best-fitting line through data points, minimising errors.
 Chromebooks, laptops, and PCs are crucial tools for coding and digital skills education. Chromebooks are ideal for web-based applications and collaborative projects, while laptops and PCs support a wider range of programming environments and software for more intensive tasks like software development and data analysis.
 Artificial Intelligence (AI) refers to the capability of a machine or computer system to perform tasks that would normally require human intelligence. This includes activities like understanding natural language, recognising patterns, learning from experience, solving problems, and making decisions.
 Machine Learning (ML) is a subset of artificial intelligence (AI) that focuses on the development of algorithms and models that enable computers to learn from and make predictions or decisions based on data. Instead of being explicitly programmed with rules, ML systems improve their performance on a task through experience, by analysing patterns in data.