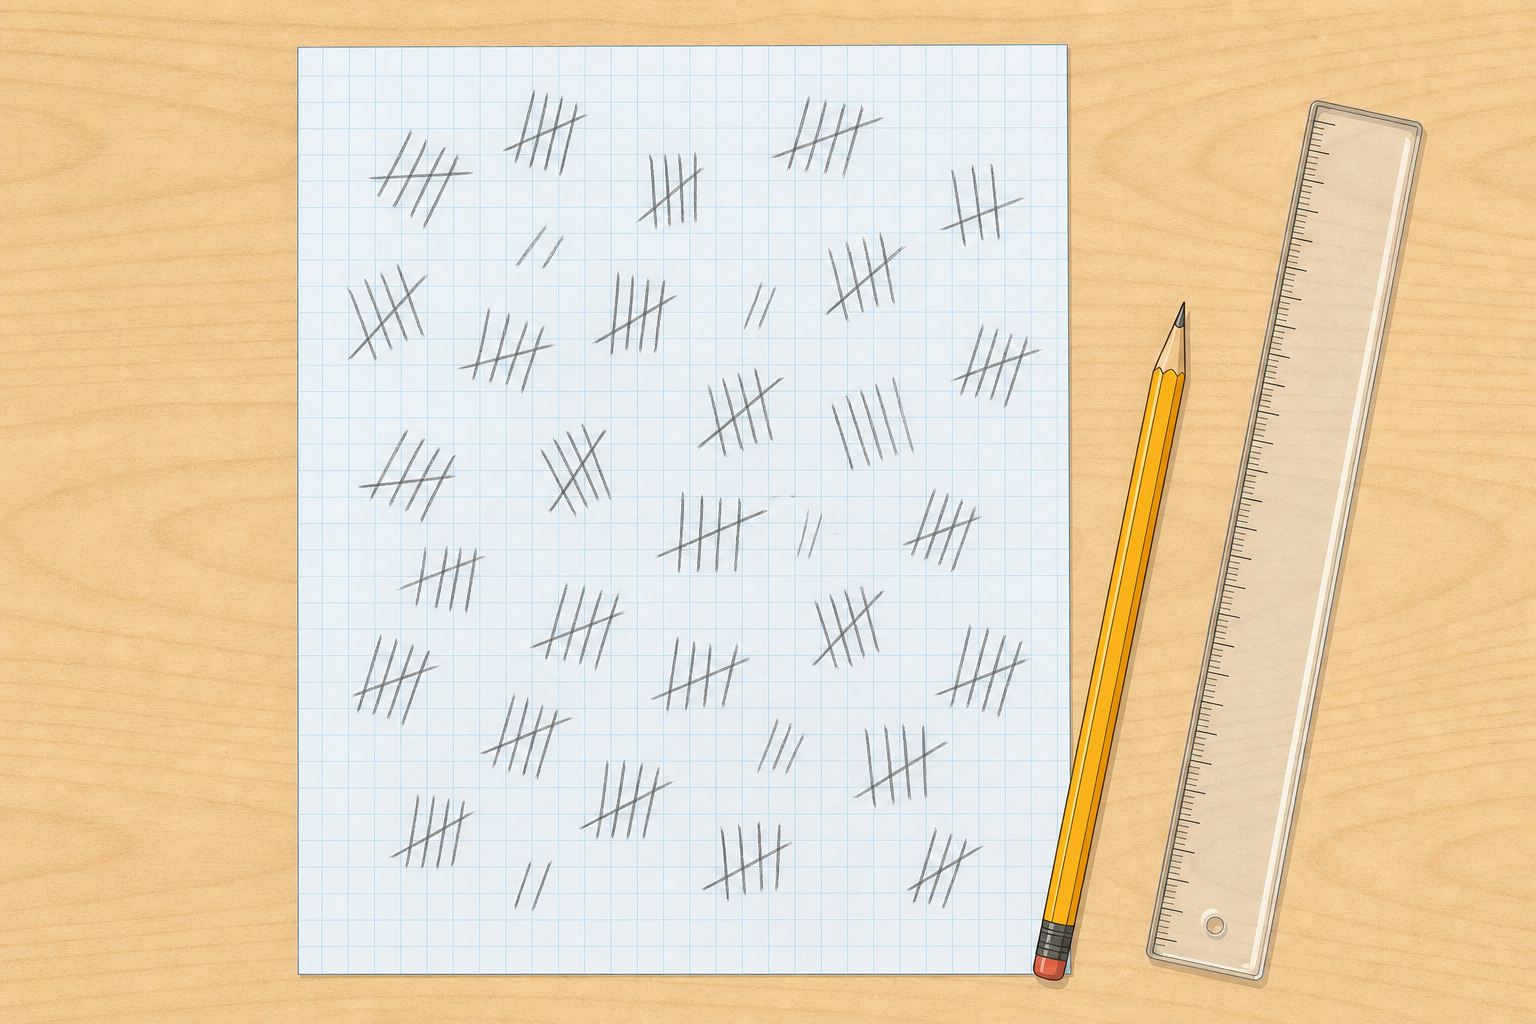
 Look at this jumbled list of class readings or tallies. Can you tell which category came out highest? Now look at the empty table beside it, the one we are going to fill in together. Which version would you trust if you had to report a clear answer?
Today we turn our real class data into a clear table and a chart, then say what the chart actually shows.
 Here is a messy list of class readings or tallies. We will organise it together so the story stops hiding.
A jumbled list is still a dataset (readings or answers gathered for a purpose), but it hides the story. A table gives every value a labelled home (each label is a category we name together). A chart turns that table into a picture so a pattern can jump out.
We will model it like this: I wonder → I organise → I chart → I think, so the pattern is earned, not guessed.
Average means add the readings in a category and divide by how many there are. With exactly two readings, the middle value and the average are the same.
Why does a jumbled list hide the story that a table and chart can tell?
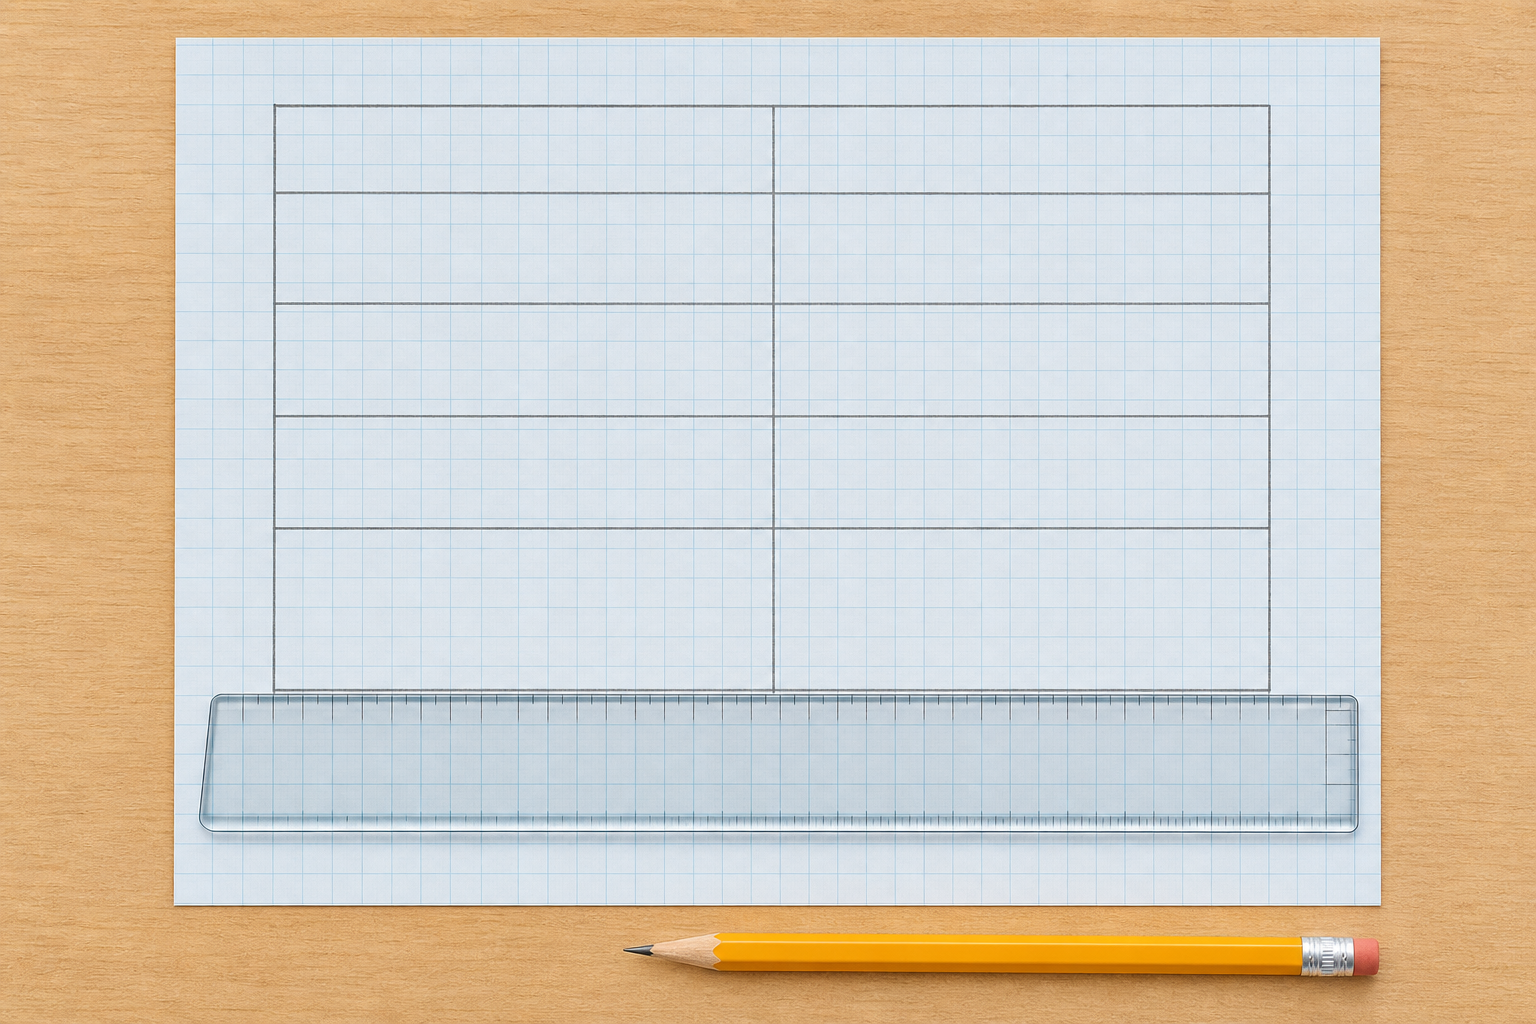 Now your group takes the shared class dataset and the categories we agreed on the board and turns them into a draft table on squared paper, using pencil and ruler. The card on this step holds the question you are answering, the steps to follow and the check to do at the end.
A table earns a pattern that a jumbled list only hides: every number gets one labelled home, and the unit tells the reader what those numbers actually are.
Next we build one table for the whole class on the board. You call out the agreed categories and the numbers from your draft tables, and they are typed in as you go; then the bars appear and we read them together.
Watch which bar is tallest and shortest. What does that tell us about our shared question?
Our class dataset as a chart
On your Investigation Journal page, record the organised class table from the side board and write what the bar chart showed. Scientists get strict here: first say only what the bars show, then say what you think it means.
Unlock the full learning experience
You're previewing this lesson. Get full access to this lesson and hundreds more — each one ready to teach, with interactive activities, printable resources and pupil progress tracking built in.
This lesson is copyright of DigitalSkills.org 2017 - 2025. Unauthorised use, copying or distribution is not allowed.